|
W.J.Wajszczuk,
M.S. Moskowitz, T. Bauld, T. Pałko, J. Przybylski, P. Dabos, R. Weiss,
M. Stopczyk, R. Żochowski, M. Rubenfire. Proceedings of “BIOSIGMA
78”, International Conference on Signals and Images in Medicine
and Biology, Paris, April 24-28, 1978. Session C.IV:
Non-aggressive methods for data acquisition, Communication C.IV.2
ABSTRACT
Mobile instrumentation and method were developed which allow
noninvasive recording and instantaneous read-out of cardiac conduction
system activity. Amplified and filtered precordial signal is digitized
and averaged over 128 or 256 consecutive cycles. QRS signal triggers
the acquisition and transfer of signal occurring during the preceding
P-R interval. Conduction system potentials had amplitude of 0.5 to 4.0
μV.
Instrumentation noise was less than 0.1 to 0.3
μV.
Invasive recordings in animals and patients showed good correlation
between the major His bundle deflections, but external recording
showed additional activity deflections including small pre-P
potentials. Bipolar anterior lead was used routinely,
but X, Y, Z reference system provided
supplemental information and X, Y plotting may facilitate pattern
recognition in pathology.
INTRODUCTION
External recording of electrical activity originating in the cardiac
conduction system was described independently in 1973 by Berbari et
al.(l), Flowers et al.(2) and Stopczyk et al.(3). Subsequent studies
by other investigators (4-6) as well as in our laboratory (7,8)
confirmed feasibility of such recordings.
The
amplitude of the potential from the bundle of His as obtained from the
precordium is generally less
than 10
μV.
This is the same order of magnitude as the noise in the system arising
from the combined influence of sources such as muscular activity,
electrical noise from the environment and noise inherent within the
instrumentation. Therefore, to extract the signal of interest, the His
bundle potential, from the signal obtained from the precordium, high
gain low noise signal amplification, filtering and averaging process
have been employed.
The
averaging process requires that the signal of interest be synchronous
to other electrical activity in the cardiac cycle and averaging is
triggered by a temporally stable signal for each of the averaged
beats. Pacemaker spike or esophageal lead (3,5) deflections were
initially used for stable triggering, but more recently adequate
triggering with precordial QRS signal has been demonstrated.(5-11)
Recently, we have also shown that in addition to detecting externally
from the precordium the low amplitude signals originating from the
His bundle and its branches, the method allows intra-atrial recording
of low voltage pre-P (S-A node region) activity. (12,13)
The
purpose of this communication is to review the technique of
QRS-triggered averaging, experimental correlations, lead selection and
potential clinical applications as well as describe portable
instrumentation and clinically applicable method which could be used
for sequential studies.
METHOD AND INSTRUMENTATION
The
method we employed utilizes the QRS complex following the His
potential to trigger the acquisition and averaging sequence. The
instrumentation is shown in schematic form in Figure 1.
Figure 1.
Block diagram – see in the original publication
The
signal from the precordial electrodes is amplified by the low noise
differential amplifier (A-Princeton Applied Research, Model 113) by a
factor of either 5,000 or 10,000. The bandpass filter contained within
the amplifier is set for a 30-300 Hz band for rejection of both low
frequency and high frequency components while allowing sufficient
bandwidth for inclusion of the His signal with minimal distortion. The
second identical pre-amplifier (B) with bandpass settings of 10-30 Hz
and a gain of 1,000 to 5,000 is used to provide the trigger signal for
acquisition of the data. The 10-30 Hz network acts as a differentiator
and together with the threshold adjustment on the transient recorder
(C-Biomation, Model 805 Waveform Recorder) provides a consistent
trigger. The circuit triggers when the first derivative of the input
ECG (QRS) exceeds the threshold value. The principle of QRS triggering
and pre-trigger data acquisition is illustrated in Figure 2.
Figure 2.
Principle of QRS triggering and of pre-trigger data acquisition - see
in the original publication
The
transient recorder (C) continuously digitizes data
with a 4
μV
resolution (referred to input) at a 5 KHz rate and stores the data
digitally. Upon detection of the QRS trigger signal, acquisition
process is halted and the contents of the digital memory containing
data acquired during the preceding P-R interval are transferred to a
digital signal averager (D-Nicolet, Model 1072) with capacity for
1,024 18 bit words. After 128 or 256 beats are acquired and averaged,
the process is terminated and the averaged signal is displayed on an
oscilloscope and photographed with a Polaroid camera.
Figure 3.
Recording equipment in a mobile cart -
see
in the original publication
The
gain in the final display is generally 0.5 to 5 μV per vertical
division of the oscilloscope and has a resolution of better than 0.1
μV. It should be noted that the resolution of the averaged signal
is improved by the presence of some degree of noise in the input
signal. The reason for this is that signal averaging is a statistical
process based on the assumption of synchronization of the His
potential with the QRS
trigger signal and the lack of synchronization of all other noise
sources with the trigger. Thus, although the initial digitization has
only 4 μV
resolution, averaging 256 repetitions allows for better than 0.1
μV
resolution in the overall system. The instrumentation in its mobile
cart ready for use at the patient's bedside is shown in Figure 3.
EXPERIMENTAL CORRELATIONS
A-V
Conduction System.
Studies were performed in anesthetized dogs (Pentobarbital 35 mg/Kg)
supported with a respirator. After mid-sternal thoracotomy, the heart
was exposed and a multipolar electrode catheter was introduced via an
incision in the tip of the right atrial appendage and advanced to the
apex of the right ventricle under control of gentle palpation. A
distal pair of electrodes were connected to the oscilloscope in a
bipolar arrangement.
in
a bipolar arrangement. Catheter was then gradually withdrawn. Upon
appearance of deflections originating from the conduction system,
recording was obtained and location of the electrode was verified by
gentle palpation. At the end of the experiment, the right ventricle
was opened and approximate course of catheter and location of
electrodes were reproduced to verify the sites of recordings. No
medications were given during the experiment. On occasion, transient
prolongations of the P-R and A-H intervals were seen on the
oscilloscope, most likely due to direct pressure over the area of the
atrio-ventricular (A-V) node. The H-V intervals remained stable.
.jpg)
Figure 4.
External recording and direct intracardiac recordings in dog
Figure 4 illustrates an example of catheter recordings along the
course of the conduction system in the right ventricle. Upper panel
includes 3 tracings: l)precordial reference bipolar low gain recording
(top tracing) with the P wave in the center of the recording and the
beginning of the QRS complex along the right edge of the illustration;
2) the averaged external high gain precordial His bundle recording
(EHB) (middle tracing) shows multiphasic deflections originating from
the conduction system; 3) the same precordial recording (bottom
tracing) photographed with lower gain for identification of the P and
QRS waves. The three lower tracings display bipolar recordings
obtained along the course of the conduction system from locations
indicated in the drawing of the heart on the left. The deflections of
the direct recordings correlate with major deflections of the
precordial averaged recording. The uppermost deflection (#1),
representing activity of the proximal portion of the A-V conduction
system, is projected on the downslope of the external recording. The
middle tracing deflection (#2) corresponds to small deflection on the
horizontal portion of external recording and represents activity of
the His bundle. The lowermost recording deflection (#3) coincides with
negative deflection preceding the onset of the QRS in the reference
lead and most likely represents activation of the terminal portions of
the ventricular conduction system including His-Purkinje-myocardial
junctions. Relatively long duration of deflections in bipolar
recordings is related to inter-electrode distance of 1 cm.
Pre-P (S-A node region) activity.
In a separate series of experiments, a multi-electrode patch with an
inter-electrode distance of 4 mm was sutured in the area of the S-A
node over the posterior aspect of the right atrium. Bipolar leads were
studied for identification of earliest epicardial activity in the S-A
node area. External averaged recording was obtained together with
epicardial recording which displayed earliest activity (Figure 5A). An
early low-amplitude deflection preceding the P wave in the external
recording (middle tracing) corresponds to early epicardial activity
deflection (bottom tracing). External recordings in humans (Figure 5B)
displayed on occasion similar early pre-P deflections. Since in most of our recordings the initial portion of
the P wave was not included in the study, their incidence of detection
is at present unknown. It appears that these deflections originate
in the S-A node region but it is not known at present whether they
represent activation of the S-A node itself or activation of the
myocardium in the immediate vicinity of the S-A node. (14)
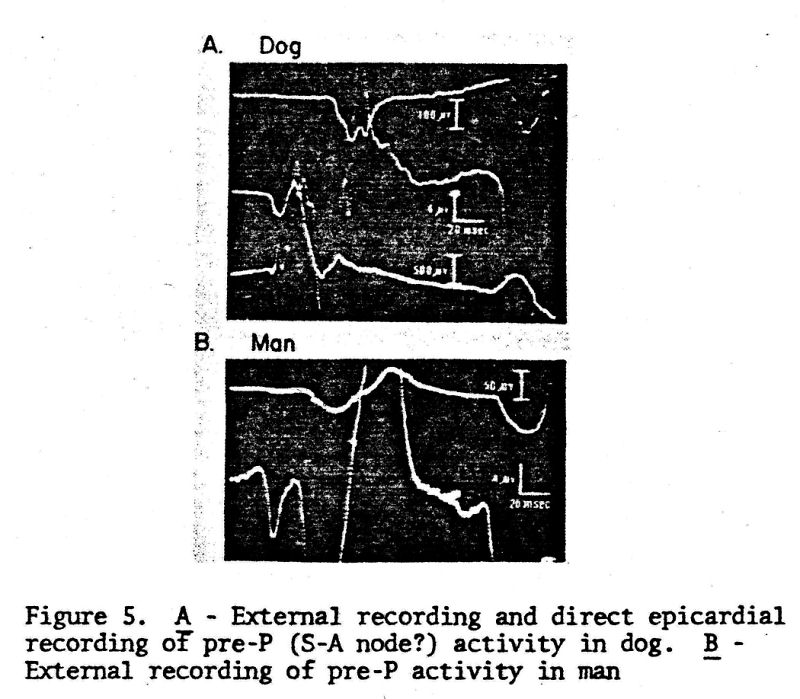
Figure 5. A - External recording and direct epicardial recording of
pre-P (S-A node?) activity in dog. B - External recording of pre-P
activity in man
LEAD SELECTION
In
most of our animal and human studies, a bipolar precordial lead (Y)
was used, with electrodes located along the sternum, in the third
right (negative) (3RICS) and fourth left (positive) intercostal space
(4LICS) a few centimeters from the sternal edge. This lead
approximates the course of the His bundle. On occasion, the positive
electrode was moved farther away in the same direction and towards the
apex (Y-1 lead). Since the A-V conduction system has a
three-dimensional distribution, it was only logical to study it with
the perpendicular system X, Y, Z. The X lead electrodes were located
on both sides of the chest in the mid-axillary line at the level of
the 4 or 5ICS. The Z lead electrodes were applied antero-posteriorly
from the 4LICS location parasternally. Examples of recordings are
shown in Figure 6. In this normal young subject, the X lead appears to
have sensitivity superior to the other leads, but similar deflections
can be identified in all leads.
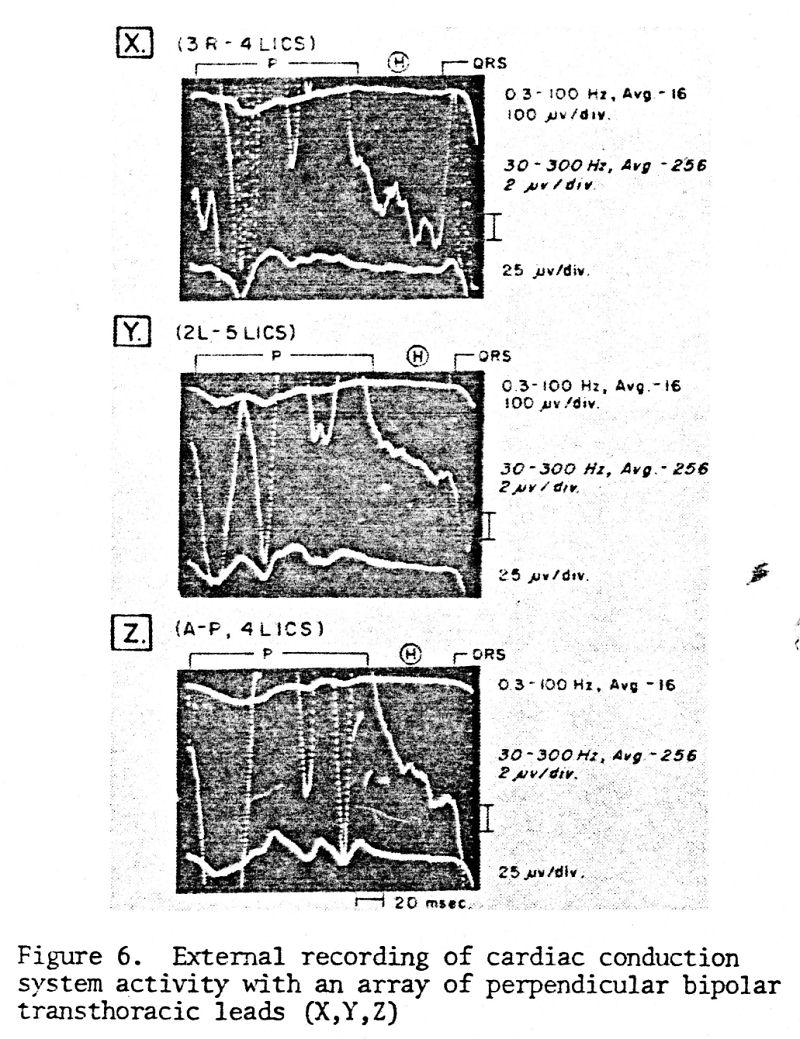
Figure 6. External recording of cardiac conduction system activity
with an array of perpendicular bipolar trans-thoracic leads (X,Y,Z)
Table I summarizes our experience in 84 patients in whom three (or at
least two) orthogonal leads were studied. There is no clear-cut
superiority of any of the individual leads. The Y or Y-1 lead appears
to have the best yield if used alone, but significant supplemental
information is gained from other leads in most cases. On occasion lead
Y+90°(perpendicular to Y over the anterior chest surface) allowed
better detection of very early deflections following closely the end
of the P wave (representing the A-V node?). In cases of bundle branch
blocks, the horizontal plane leads (X and Z) may be superior, possibly
due to the fact that disturbance of conduction alters the sequence of
activation to the highest degree in this plane. Frontal (Y+X) or
sagittal (Y+Z) plane leads, because of their Y lead component
approximating the course of the His bundle, may be best for detection
of the abnormality of the A-V conduction (below the A-V node). On
theoretical grounds, the Y+90° lead may be appropriate to study the
A-V node since it approximates its anatomical course.
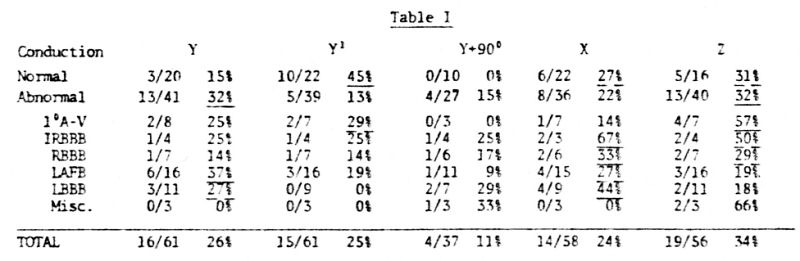
Explanation: The denominator indicates the total number of patients
studied with this lead. The numerator indicates the number of patients
in whom the best recording was obtained with this particular lead.
1°A-V = first degree A-V block, IRBBB = incomplete right bundle branch
block, RBBB = right bundle branch block, LAFB = left anterior
fascicular block, LBBB = left bundle branch block, Misc. = myocardial
infarction with atypical intraventricular conduction delay.
As
theoretically expected (due to the continuous nature of the conduction
system) and in contrast to direct intracardiac recordings, it was
noted that the external recordings frequently contained numerous
deflections. Progress of activation which follows its
three-dimensional course becomes altered and more complex in the
conditions of intra-ventricular blocks. It is postulated, and
studies are in progress to determine whether the three-dimensional
display (plotting of lead pairs in perpendicular planes), will
facilitate grouping of curves into patterns typical for each
pathological condition. Examples of displays obtained for a normal
individual and a patient with acute myocardial infarction and 2:1 A-V
conduction block are presented in Figure 7.
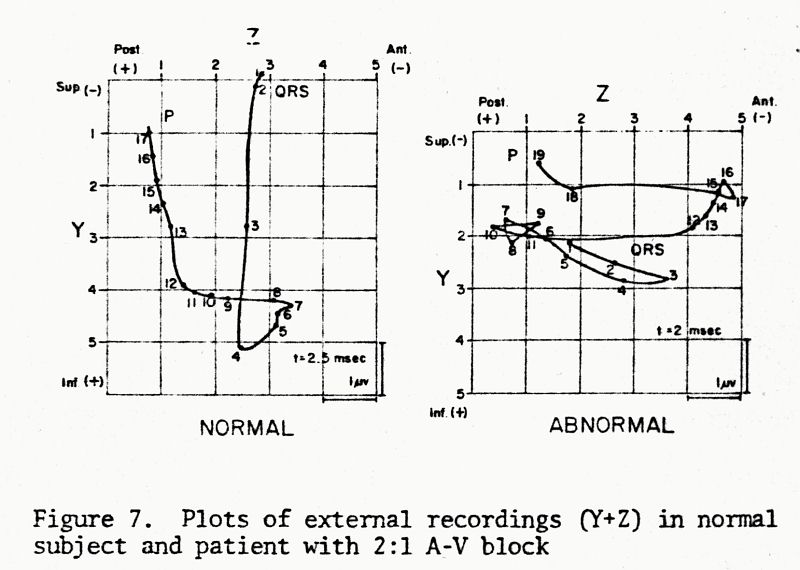
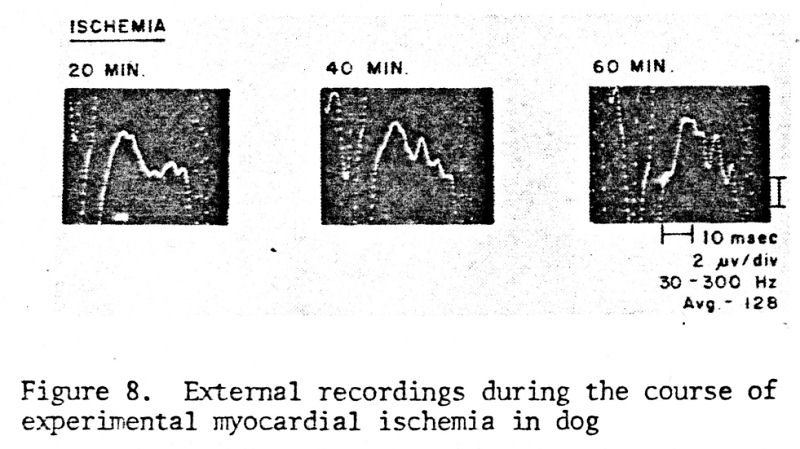
Figure 8. External recordings during the course of experimenta1
myocardial ischemia in a dog.
Another example is presented in Figure 9.
Before direct recordings could be obtained, transient RBBB was
produced inadvertently during placement of endo-cardial electrodes and
was associated with sinus tachvcardia. The time interval between the
end of the P wave and the onset of altered early QRS forces became
shortened. After administration of propranolol, heart rate decreased
and additional deflections are visualized prior to QRS. Above
examples indicate the obvious need for detailed correlations with
mapping of the conduction system activity, to allow precise
identification of deflections and diagnosis.
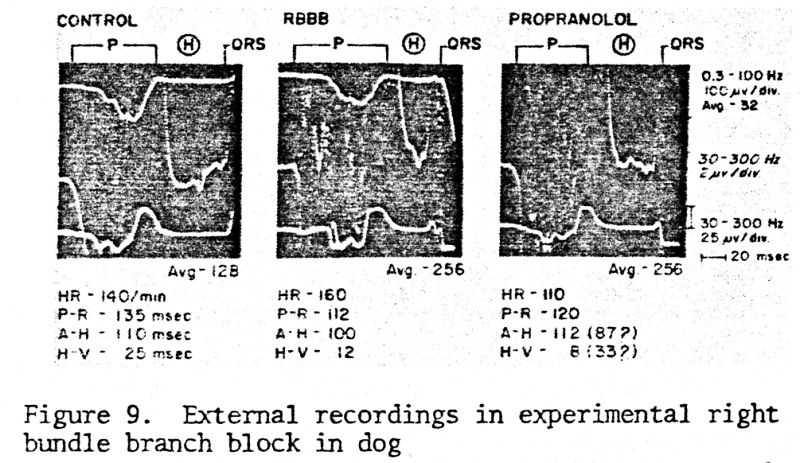
Figure 9. External recordings in experimental right bundle branch
block in dog
DISCUSSION AND SUMMARY
External recording allows detection of the activity of the cardiac A-V
conduction system on the surface of the body. It is not known whether
activity of the A-V node can be detected externally or separated from
forces of atrial activation. Similarly, activation from the atrial
pacemaker site can be demonstrated, however, it is not known whether
activity of the S-A node proper can be detected.
Triggering with QRS appears to provide adequate synchronization
without significant loss of information. Noise level originating from
the instrumentation, environment and muscle activity can be
effectively reduced well below the level of conduction system
potentials.
The
major problem now concerns proper identification of deflections, in
particular in pathologic conditions of conduction disturbances.
Experimental studies with simulation of pathology are needed to
provide answers and correlations. Accordingly, new norms for A-H and
H-V intervals will have to be developed.
It
appears that due to the three-dimensional distribution of the
conduction system in the heart, a similar three-dimensional approach
to recording of its potentials externally is most appropriate to
prevent loss of significant information. The information appears to be
supplemental in individual orthogonal leads. Due to the complexity of
the anatomical structure and its distribution in the heart, scalar
recordings may be difficult to interpret. Plotting from pairs of leads
in three orthogonal planes may facilitate pattern recognition, in
particular, in pathology of conduction (intra-myocardial blocks).
BIBLIOGRAPHY
1.
Berbari, E.J., Lazzara, R., Samet, P., Scherlag, B.J.: Noninvasive
technique for detection of electrical activity during the P-R
segment. Circulation 48:1005, 1973.
2.
Flowers, N.C,, Horan, L.G.: His bundle and bundle-branch recordings
from the body surface. Circulation 7-8 (suppl IV):.IV-102, 1973.
3.
Stopczyk, M.J., Kopeć, J., Żochowski, R. J., Pieniak, M.: Surface
recording of electrical heart activity during the P-R segment in man
by computer averaging technique. Int. Res. Com. Syst. (73-8) 11, 21,
2, 1973.
4.
Berry, H., Ranganathan, N., Winchester, B.T.: Surface His bundle
recordings by the signal averaging method. Circulation 49-50 (suppl
III): III-215, 1974.
5.
Hishimoto, Y., Sawayana, T.: Non-invasive recording of His bundle
potential in man. Simplified method. British Heart Journal 37:635,
1975.
6.
Furness, A., Sharratt, G.P., Carson, P.: The feasibility of detecting
His-bundle activity from the body surface. Cardiovascular Research
9:390, 1975.
7.
Wajszczuk, W. J,, Stopczyk, M.J., Żochowski, R.J., Rubenfire, M.:
On-line precordial His-Purkinje activity recording in spontaneous
rhythm in man by pre-memorized computer averaging. Abstracts of the
Vth International Symposium on Cardiac Pacing, Tokyo, March 14-18,
1976.
8.
Wajszczuk, W.J., Pałko, T., Stopczyk, M.J., Przybylski, J., Bauld, T.,
Moskowitz, M.S., Rubenfire, M.: Mobile instrumentation system for
totally noninvasive external recording and instantaneous display of
the cardiac conduction system (HIS BUNDLE) activity. Proceedings: AAMI
12th Annual Meeting, March 13-17, 1977, San Francisco, California,
page 117.
9.
Berbari, E.J., Lazzara, R., El-Sherif, N., Scherlag, B.J.:
Extracardiac recordings of His-Purkinje activity during conduction
disorders and junctional rhythms. Circulation 51:802, 1975.
10.
Wajszczuk, W.J., Pałko, T., Stopczyk, M.J., Bauld, T., Moskowitz,
M.S., Przybylski, J., Zochowski, R.J., Rubenfire, M.: Noninvasive
real-time recording of cardiac conduction system activity:
Instrumentation and method used in QRS-triggered averaging in
"Noninvasive Cardiovascular Diagnosis," edited by Edward B.
Diethrich, M.D., University Park Press, 1978.
11.
Wajszczuk, W.J., Stopczyk, M.J., Moskowitz, M.S., Żochowski, R.J.,
Bauld, T., Dabos, P., Rubenfire, M.: Noninvasive recording of
His-Purkinje activity in man by QRS-triggered signal averaging.
Circulation (submitted for publication), 1978.
12.
Stopczyk, M.J., Pieniak, M., Wajszczuk, W.J., Rubenfire, M.: Sinus
node activity in man and animal studies recorded intra-atrially by an
on-line pre-memorized averaging technique. Cardiac Pacing (Proceedings
of the Vth International Symposium, Tokyo, March 14-18, 1976).
Excerpta Medica, Amsterdam, International Congress Series No. 395, pp
13-18.
13.
Stopczyk, M.J., Wajszczuk, W.J., Żochowski, R.J., Rubenfire, M.: Human
and Canine pre-P (sino-atrial node) activity recording from the right
atrial cavity by signal averaging. Circulation (submitted for
publication), 1978.
14. Masuda, M.O., Paes de Carvalho, A.: Sinoatrial transmission and
atrial invasion during normal rhythm in the rabbit heart. Circulation
Res 37:414, 1975. |