|
W.J. WAJSZCZUK, J. PRZYBYLSKI, T.
PAŁKO, M. WORPELL, TH. BAULD AND M. RUBENFIRE.
Electrocardiology '81, Budapest, Hungary. Z. Antaloczy, and I.
Preda (eds.)., pp. 89-94.
(From the Institute of Physiological Sciences of the Medical Academy,
Institute of Precision and Biomedical Engineering, Technical
University, Warsaw, Poland and Section of Cardiovascular Diseases,
Department of Medicine, Sinai Hospital and Wayne State University,
Detroit, Michigan, USA.
*
Supported by Sinai Hospital General Research Support Grant RR-05641,
Cardiology Research and Education Fund, Sinai Hospital Guild.)
Basic laboratory and clinical research during the past eight years,
has demonstrated the feasibility of recording potentials generated in
the cardiac conduction system from the surface of the chest.
The
technique involves high-gain signal amplification, filtering and
averaging of one or more hundreds of consecutive cardiac cycles to
free the signal of interest from the noise originating from the
patient, instrumentation, and the environment. Initial studies allowed
identification of the His bundle activity. (Wajszczuk et al 1978
a,b,c). More recently, we have also demonstrated the ability to record
non-invasively the sinus node region potentials. (Pałko et al.
1980,
Wajszczuk et al. 1981). In this report, we summarize briefly our
experience with the clinical application of the method and present
supplemental data which substantiate the origin of the individual
waveforms.
INSTRUMENTATION AND METHODS
The four-channel system allows QRS pre-triggering, analog/digital
conversion, variable filter selection, and signal averaging. In
addition, it has the ability to plot vectorcardiograms of any portion
of the signals and has provisions for instantaneous display and hard
copy records. The system is self-contained and mobile. Digitizing can
be performed either at 8 bit or 12 bit resolution.The main frame has a
4 K memory which then allows 1 K of memory per channel. The
sampling rate is 2 KHz. The input pre-amplifiers are set at a gain of
104 with fixed bandwidth of 0.5-8,000 Hz. They are used to acquire
simultaneously any three external signals plus a surface lead for
triggering. The outputs of the pre-amplifiers are fed to a 4-channel
amplifier/filter with a gain range of 0.2-80. Normally, the bandwidth
for signal acquisition is set identically in three channels at 0.5-300
or 30-300 Hz and at 10-30 Hz for the trigger signal. Anti-aliasing
filters are set at 1 KHz. Triggering threshold can be adjusted so that
triggering occurs when the slope of the QRS exceeds a certain value.
The window can be preselected to include various time segments of the
incoming signal before or after the trigger signal.
The most commonly used leads include the anterior chest ("Y") lead
with a negative electrode in the third right intercostal space
parasternally and a positive electrode in the fifth left intercostal
space in the area of the apex, the antero-posterior (Z) lead with the
positive electrode anteriorly and parasternally at the level of left
fourth intercostal space and the X lead with the electrodes at the
same level in the right and left (positive) mid-axillary line.
Additional information is occasionally obtained by using a bipolar
precordial lead perpendicular to the Y lead (Y+90) or unipolar
precordial leads at various left parasternal levels. (Wajszczuk et al.
1978 b,c)
RESULTS
Clinical Studies.
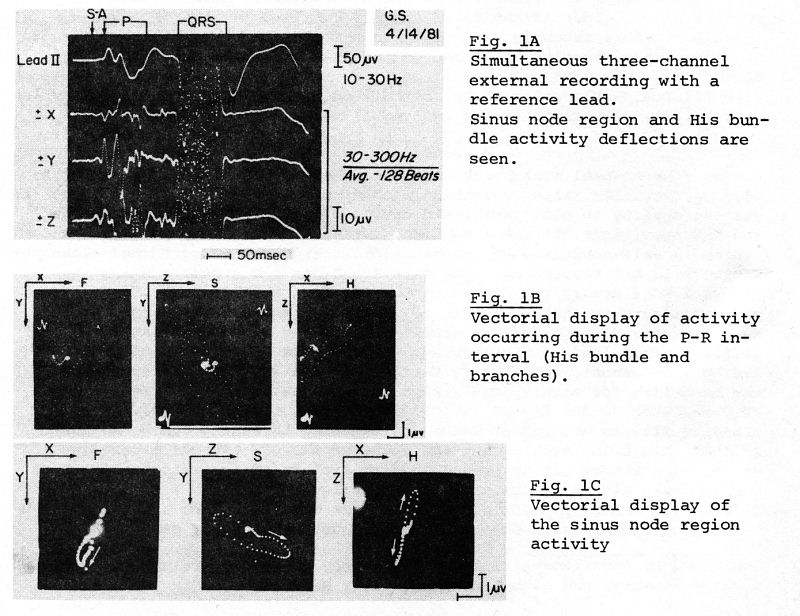
An example of a recording demonstrating pre-P (sinus node region) and
His bundle activity is illustrated in Figure 1A. Multiple
deflections, which occur asynchronously in the three perpendicular
leads, represent the activation of various portions of the conduction
system (His bundle and branches). Late deflections, best seen in
leads Y and Z, which immediately precede the onset of ventricular
activation, probably originate from the terminal branching portions of
the His bundle or from the His-Purkinje system (see below). The onset
of the P wave in the reference lead is preceded by small deflections
which represent the activation of the sinus node region. These
potentials are best seen in the Z lead. Vectorial plotting of the
potentials developing during the P-R interval is shown in Figure 1B
and of the sinus node region activity in Figure 1C. Vectorial display
aids in analysis of the directions, velocity, and duration of the
spread of activation. In patients, the display of the His bundle
activity can best be obtained with 30-300 Hz filtering. In
experimental animals, narrowing the bandwidth to 100-300 Hz was
sometimes advantageous because it allowed elimination of the slopes
of atrial repolarization. (Wajszczuk et al.1978 b).
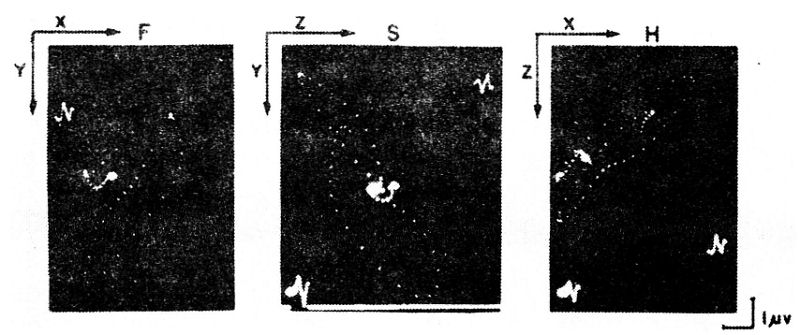
Figure 1B - magnification, in an attempt to improve visualization of
the loops
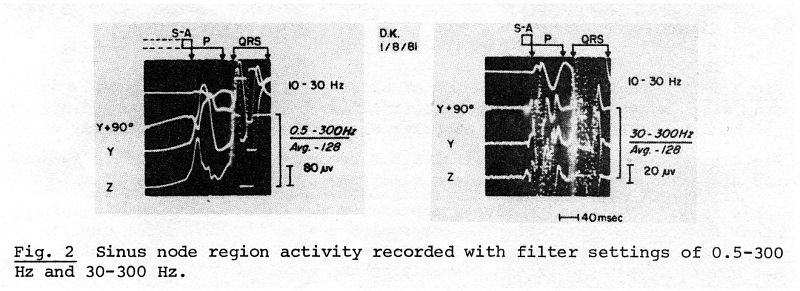
Figure 2 illustrates examples of
recordings of the sinus node region activity. The filter setting of 0.5-300 allows detection of early
low frequency and low voltage components of spontaneous depolarization,
while filter setting of 30-300 Hz accentuates the transition points
between the components of the slopes and is more advantageous for time
interval measurements, although early diastolic potentials are
eliminated.
The success rate in obtaining adequate recordings for time interval
measurements was 85% with the older, single channel instrumentation,
which required a relatively noise-free environment. (Wajszczuk et al.
1978 a,b,c) The currently used instrumentation (described above),
which has better resolution and memory capacity, provided excellent
and reproducible recordings in over 90% of the patients studied. A
3-dimensional system of transthoracic bipolar leads was necessary to
assure the completeness of representation of the activity originating
in the conduction system.
Comparisons
with Experimental Mapping.
Various techniques of direct mapping of the sequence of activation
have been used in order to identify the origin of individual
deflections occurring before the P wave and during the P-R interval.
(Stopczyk et al.1979; Wajszczuk et al.1979) They included direct
recordings with intra-cardiac catheter electrode localized in the
sinus node region, the
A-V node region and along the course of the His
bundle, a multi-electrode patch on the epicardium over the sinus node
region or sutured over the right aspect of the interventricular
septum and needle electrodes introduced into the A-V node region and
along the course of the His bundle including the terminal
His-Purkinje-myocardial junctions.
An example of simultaneous recordings of a reference lead, external X
and Z lead, unipolar intra-atrial catheter recording from the region
of the A-V node and a bipolar intracavitary right ventricular
recording from the common His bundle region is illustrated in Figure
3.
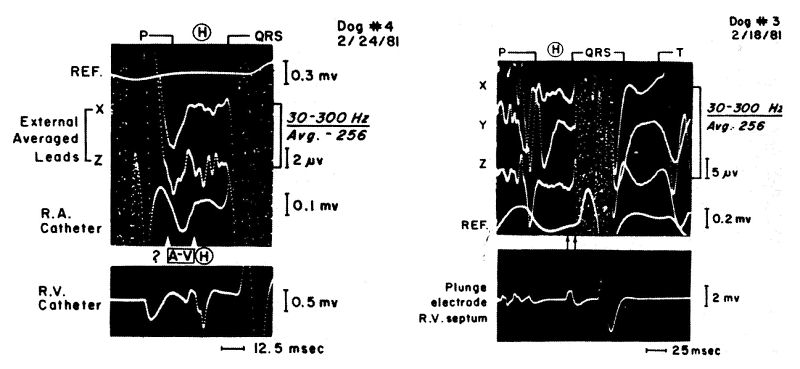
Fig.3(left) Simultaneous recording of external X and Z leads, direct
recording with right atrial catheter electrode in the A-V node region
and direct His bundle recording with the catheter electrode in the
right ventricle.
Fig.4 (right) Simultaneous external X,Y,Z recordings with the
reference lead and direct recording with a plunge electrode in the
lower R-V septum.
Multiple deflections of activity in the external recordings continue
beyond the onset and termination of the His bundle spike in the direct
recording. The large negative deflection in the intra-atrial recording
immediately follows the atrial activity potentials and precedes the
His bundle potentials. It is assumed that this deflection represents
the activity of the A-V node region.
Corresponding deflections can be seen in the external averaged leads.
In this animal, the H-V interval was 35 msec and the interval between
the onset of the A-V node region activity deflection and the onset of
ventricular activity was approximately 50 msec.
Figure 4 demonstrates direct recording obtained with a needle
electrode inserted in the peri-apical location on the right septal
surface. Its deflection coincides with the terminal portions of the
His bundle activity deflections, which immediately precede the onset
of ventricular activation.
It is felt that this activity represents the potentials from the
terminal His-Purkinje system. The interval between this deflection
and the subsequent myocardial activity deflection signifies that the
conduction did not spread from these fibers directly to the myocardium
but arrived there with a delay via a circular route.
Experimental Blocks.
In the experiment illustrated in Figure 5, after ablation of the sinus
node and trans-section of the right bundle branch, the recording shows
change in the morphology of the His bundle and QRS deflection. There
is greater separation between the His spikes and prolongation of the
H-V interval. The heart rate was 40/minute and it appeared that the
rhythm initiated in the His bundle below the point of trans-section.
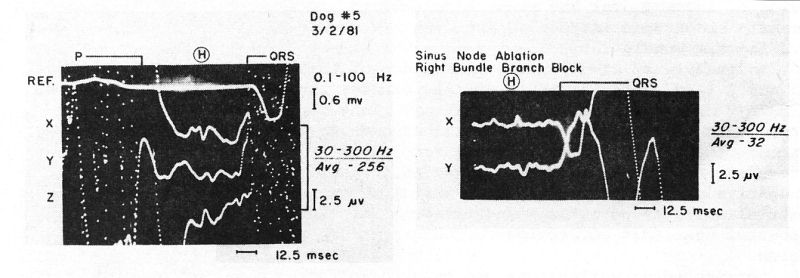
Fig. 5 External recordings obtained before and after sinus node
ablation and trans-section of the right bundle. The rhythm appears to
initiate in the His bundle below trans-section and QRS demonstrates
altered morphology.
Pharmacologic Interventions.
Besides the potential diagnostic applications in blocks, and for
serial studies of cardiac conduction, the non-invasive recordings
could be used for evaluation of the effect of medications. An example
of lack of significant changes in conduction after intravenous
administration of Xylocaine is shown in Figure 6.
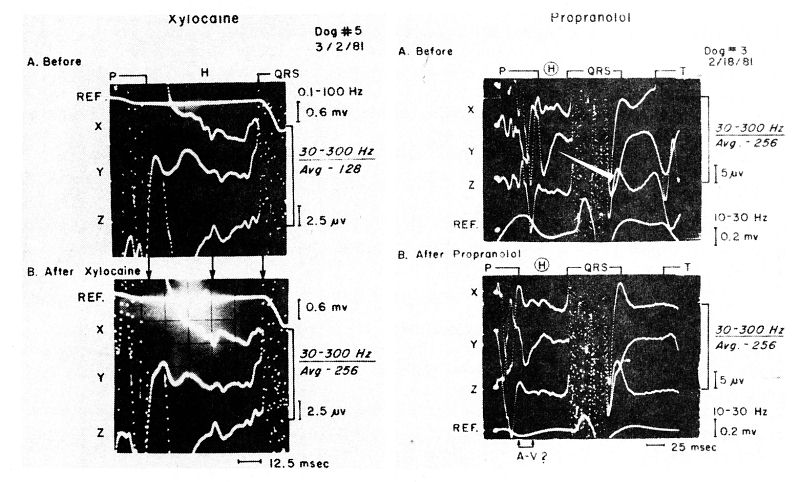
Fig. 6 (left) External recordings taken before and after I.V.
administration of Xylocaine in a dog. No change in the P-R interval or
His bundle activity deflections was demonstrated.
Fig. 7 (right) External recordings obtained before and after
intravenous administration of Propranolol in a dog. Note prolongation
of the P-R interval, increased separation of the His bundle activity
deflections and better visualization of early (A-V nodal?) potentials
(in the Y lead).
Figure 7 shows; on the other hand, a prolongation
of the P-R interval and increased separation of individual
deflections of the His bundle activity after administration of
Propranolol. Also, in the Y lead, the early negative deflection (A-V
node region activation?), which follows atrial depolarization is
better seen (see also Figure 3). We have previously demonstrated, with
the non-invasive recordings, the Propranolol-induced prolongation of
the sino-atrial conduction time. (Wajszczuk et al. 1981).
SUMMARY AND CONCLUSIONS
Our investigative efforts over the past several years have been aimed
at the development of instrumentation and refinement of a method to
allow non-invasive recording of electrical activity originating in or
around the sinus node, His bundle and its branches, and possibly the
A-V node region or A-V node itself. The latter is difficult to
identify non-invasively as well as invasively, perhaps because of its
overlapping with the terminal forces of atrial depolarization and
repolarization. Further study of the frequency spectra of atrial
activation and of the A-V node depolarization potentials may allow
selective filtering leading to visualization of the A-V node
potentials.
A
three-dimensional lead system appears to be necessary for complete
evaluation of the three-dimensional cardiac conduction system. The
origins of multiple deflections that can be recorded during the P-R
interval have yet to be fully established. Although the H-V interval
measured non-invasively appears to be similar to that measured
invasively, on occasion difficulty occurs in proper selection of
points or deflections for measurements. Despite pattern variability
among normal individuals, the recordings are reproducible in the same
individual, when similar frequency bands are utilized. No typical
diagnostic patterns or norms have been yet established for abnormal
conditions such as bundle branch blocks or fascicular blocks. To
establish criteria for abnormality, a large collection of patients
with clinical-pathologic correlations and further experimental
simulations will be needed.
Since the non-invasive method of recording cardiac potentials yields
reproducible results, it will be very useful for serial determination
and long-term follow-up of cardiac conduction abnormalities.
Similarly, the effect of medications on conduction parameters may be
measured. While the technique of signal averaging can be applied only
during stable conditions of cardiac rhythm and conduction, a recent
technical advance has allowed the non-invasive analysis of a single
heart beat. We could thus extend the application of the non-invasive
method to conditions of unstable cardiac rhythm, which may be
invaluable for rhythm analysis. This new technique will be reported at
this symposium in a separate communication from our laboratories.
(Palko et al.1981).
Acknowledgements: We wish to thank Mrs. Linda A. Gabel for her
excellent secretarial assistance and Mrs. Janet Kopka and Miss Cathy
Bartlett for preparation of graphic material.
REFERENCES
PAŁKO, T., WAJSZCZUK, W.J., PRZYBYLSKI, J.,
STOPCZYK, M.J., BAULD, T., RUBENFIRE, M. (1980): Noninvasive recording
of the activity of the sino-atrial node. IRCS Medical Science 8: 337.
PAŁKO, T., WAJSZCZUK, W.J., KOHUTNICKI, M., PAWLICKI, G.,
BAULD, T., RUBENFIRE, M. (1981): Beat-to-beat high-resolution
non-invasive recording from the cardiac conduction system. Proceedings
of the 8th International Congress on Electrocardiology, Budapest,
Hungary, September 1-4, 1981.
STOPCZYK, M.J., WAJSZCZUK, W.J., ŻOCHOWSKI, R.J., RUBENFIRE, M.
(1979): Pre-P (sino-atrial node region) activity recording from the
right atrial cavity by signal averaging. PACE 2: 156-161.
WAJSZCZUK, W.J. , STOPCZYK, M.J., MOSKOWITZ, M.S., ŻOCHOWSKI,
R.J., BAULD, T., DABOS, P.L., RUBENFIRE, M. (1978a): Noninvasive
recording of His-Purkinje activity in man by QRS-triggered signal
averaging. Circulation 58: 95-102.
WAJSZCZUK, W.J., PAŁKO, T., BAULD, T., PRZYBYLSKI, J.,
RUBENFIRE, M. (1978b): Non-invasive real-time recording of cardiac
conduction system activity. IN: Noninvasive Cardiovascular Diagnosis.
Current Concepts, edited by Edward B. Dietrich, University Park Press,
Baltimore, Maryland, Chapter 35, pages 337-359.
WAJSZCZUK, W.J., MOSKOWITZ, M.S., BAULD, T., DABOS, P., WEISS,
R., RUBENFIRE, M. (1978c): Noninvasive external recording of cardiac
conduction system (His bundle) activity. Medical Instrumentation 12:
282-287.
WAJSZCZUK, W.J., PAŁKO, T., PRZYBYLSKI, J., STOPCZYK, M.J.,
HAMADA, 0., BAULD, T., MOSKOWITZ, M.S., RUBENFIRE, M. (1979) :
Feasibility of non-invasive recording of the cardiac conduction
system activity: Experimental correlations. IN: Progress in
Electrocardiology, edited by Peter W. Macfarlane, Pitman Medical
Publishing Co., Kent, England, pages 27-32.
WAJSZCZUK, W.J., PAŁKO, T., PRZYBYLSKI, J., STOPCZYK, M.J.,
BAULD, T.J., RUBENFIRE, M. (1981): External recording of sinus node
region activity in animals and in man. Proceedings of the
International Symposium on the Signal Averaging Technique, in Clinical
Cardiology, Cologne, May 7-9, 1981, Springer-Verlag. (IN PRESS) |